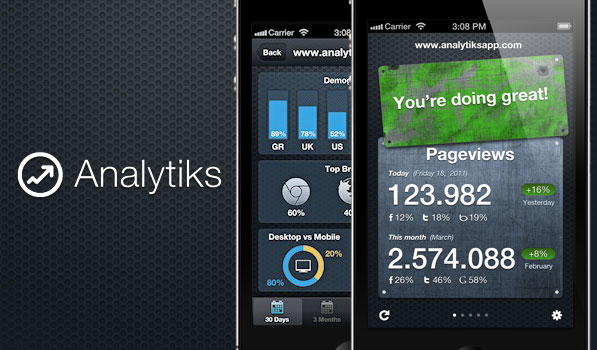
Analytiks is a surprisingly not-so-popular app for the iPhone that brings you your Google Analytics data in style. Designed and developed by a Greek developer trio, Analytiks is a wonderful way of looking at your stats on your iPhone.
Analytiks prides itself in showing you only the relevant data that you can quickly take look at and move on. Presented on a terribly scratched metal sheet, Analytiks will show you you site’s pageviews for Today along with the percentage rise compared to yesterday. It also shows you the pageviews for the current month and will neatly segregate traffic originating via Facebook, Twitter and Google. If you have multiple websites set up under a single account, Analytiks takes care of those as well. Analytiks also adds encouraging messages on top of the data table, but I personally find it of no use.
If you turn the device from portrait to landscape, the data is laid out on a beautiful graph. But Analytiks’s most beautiful feature only reveals itself when you double tap the screen (in portrait mode). Analytiks takes all the data and presents a stunning infographic for you to consume. Stats like demographics, top browsers, Desktop vs. mobile and PC vs. Mac are stunningly presented on the screen.
Available for just $0.99 on the App Store, Analytiks is a wonderful little app if you’re looking for a quick way to look at your stats without getting lost in the plethora of numbers Google Analytics throws at you. I personally use Analytiks on my iPhone and Gaget on my Mac — the only Dashboard client I have.
